Free Graph Alt Text Generator
Alt text for charts and graphs. Write chart alt text that communicates type, context, and the key insight for accessibility and SEO.
Drag & drop an image here, or click to select one
Supports JPG, PNG, WEBP
Want to generate alt text across platforms?
Improve accessibility and SEO across your site with AI-powered alt text.
What Should Graph Alt Text Explain?
Graph alt text should tell users what kind of chart they are looking at, what data it represents, and the most important trend or insight.
Chart type and topic
Mention whether it is a line chart, bar chart, pie chart, scatter plot, or dashboard and what the chart is measuring.
Main trend
Focus on the big takeaway, such as growth, decline, comparison, peak, gap, or unusual change.
Accessible details
For complex graphs, use concise alt text and provide a nearby data table or longer description for exact values.
Graph Alt Text Generator Examples
Strong alt text describes the image clearly, includes the important visible details, and stays useful for accessibility.
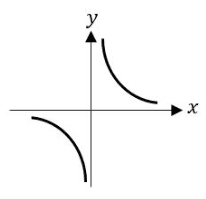
Hyperbola Graph
Weak
math graph
Better
Graph of a hyperbola with two branches in the first and third quadrants on x and y axes.
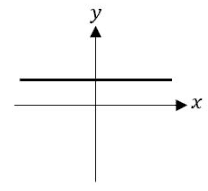
Horizontal Line Graph
Weak
line graph
Better
Graph of a horizontal line above the x-axis on a Cartesian coordinate system.
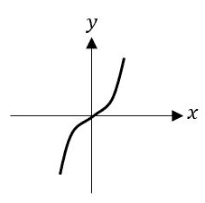
Cubic Function Graph
Weak
function graph
Better
Graph of a cubic function passing through the origin on x and y axes.
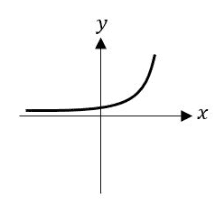
Exponential Growth Graph
Weak
growth graph
Better
Graph of an exponential growth curve rising steeply to the right on x and y axes.
How to Generate Graph Alt Text
Upload the chart or graph image.
Generate a concise draft with AI.
Check the chart type, labels, time range, and key takeaway for accuracy.
Add a data table or longer description nearby if exact values are important.
Related Alt Text Tools and Guides
Graph Alt Text FAQ
What should graph alt text include?
Name the chart type, subject, axes (if important), time range, and the key trend or takeaway (e.g., “Sales rose 40% from 2022 to 2024”).
Do I list all data points?
No. Summarize the trend or the most important comparisons. Link to a data table if detailed values are required.
How long should it be?
Aim for a concise summary (1–2 sentences). Provide the main insight instead of raw numbers.
What about complex dashboards?
Describe the overall purpose and primary finding. Consider adding a caption or separate text for details if needed.
Should I include the chart title?
Yes, if the title helps explain the subject. Include the chart type and title before summarizing the main trend.
Can graph alt text help with SEO?
Yes, descriptive graph alt text can help search engines understand the image, but the main goal should be accessible data communication.